Data Visualization & Analytics UX
We design dashboards and analytics experiences that help people see what changed, understand why it matters, and know what to do next without drowning in charts.
We design dashboards and analytics experiences that help people see what changed, understand why it matters, and know what to do next without drowning in charts.

More data is not the same as more clarity.
Analytics products often grow one chart at a time. Every metric competes for attention, filters feel unpredictable, and users lose context as they move from an overview into detail. We start with the questions people need to answer and the decisions the product needs to support, then shape the hierarchy, visualizations and interactions around those jobs.
“
What you get
Decision-View Mapping
Analytics Information Hierarchy
Dashboard and Report Layouts
Chart and Table Selection
Filters and Time Controls
Drill-Down and Exploration Flows
States and Data Confidence
Responsive Analytical Views
Accessible Visualization Patterns
Visualization Component Rules
Clarity Before Charts
We map agreed metrics and user questions to the views and actions they need before choosing a chart. That keeps every analytical view tied to a real decision instead of a decorative visualization.
Exploration Without Losing Context
Filters, comparisons and drill-downs should help users investigate without forcing them to remember where they started. We prototype the full overview-to-detail journey with realistic data and states.
A Visualization System That Scales
Reusable rules keep charts, legends, tooltips, annotations, comparisons and responsive behavior consistent as metrics and product areas grow.
“
How it works
Analytics UX Process
Analytics UX Process
Analytics UX Process
1. Discovery
We align on users, questions, signals, actions, data constraints and the moments where confidence matters most.
2. Architecture
We define the overview-to-detail hierarchy, comparisons, filters, analytical view transitions and progressive disclosure before visual styling begins.
3. Design
We design charts, tables, tooltips, filters, drill-downs and responsive states in realistic flows so the interaction can be reviewed before development.
4. Validation
We test comprehension, exploration, keyboard and responsive behavior, then document reusable rules and implementation-ready specifications.
Featured Case
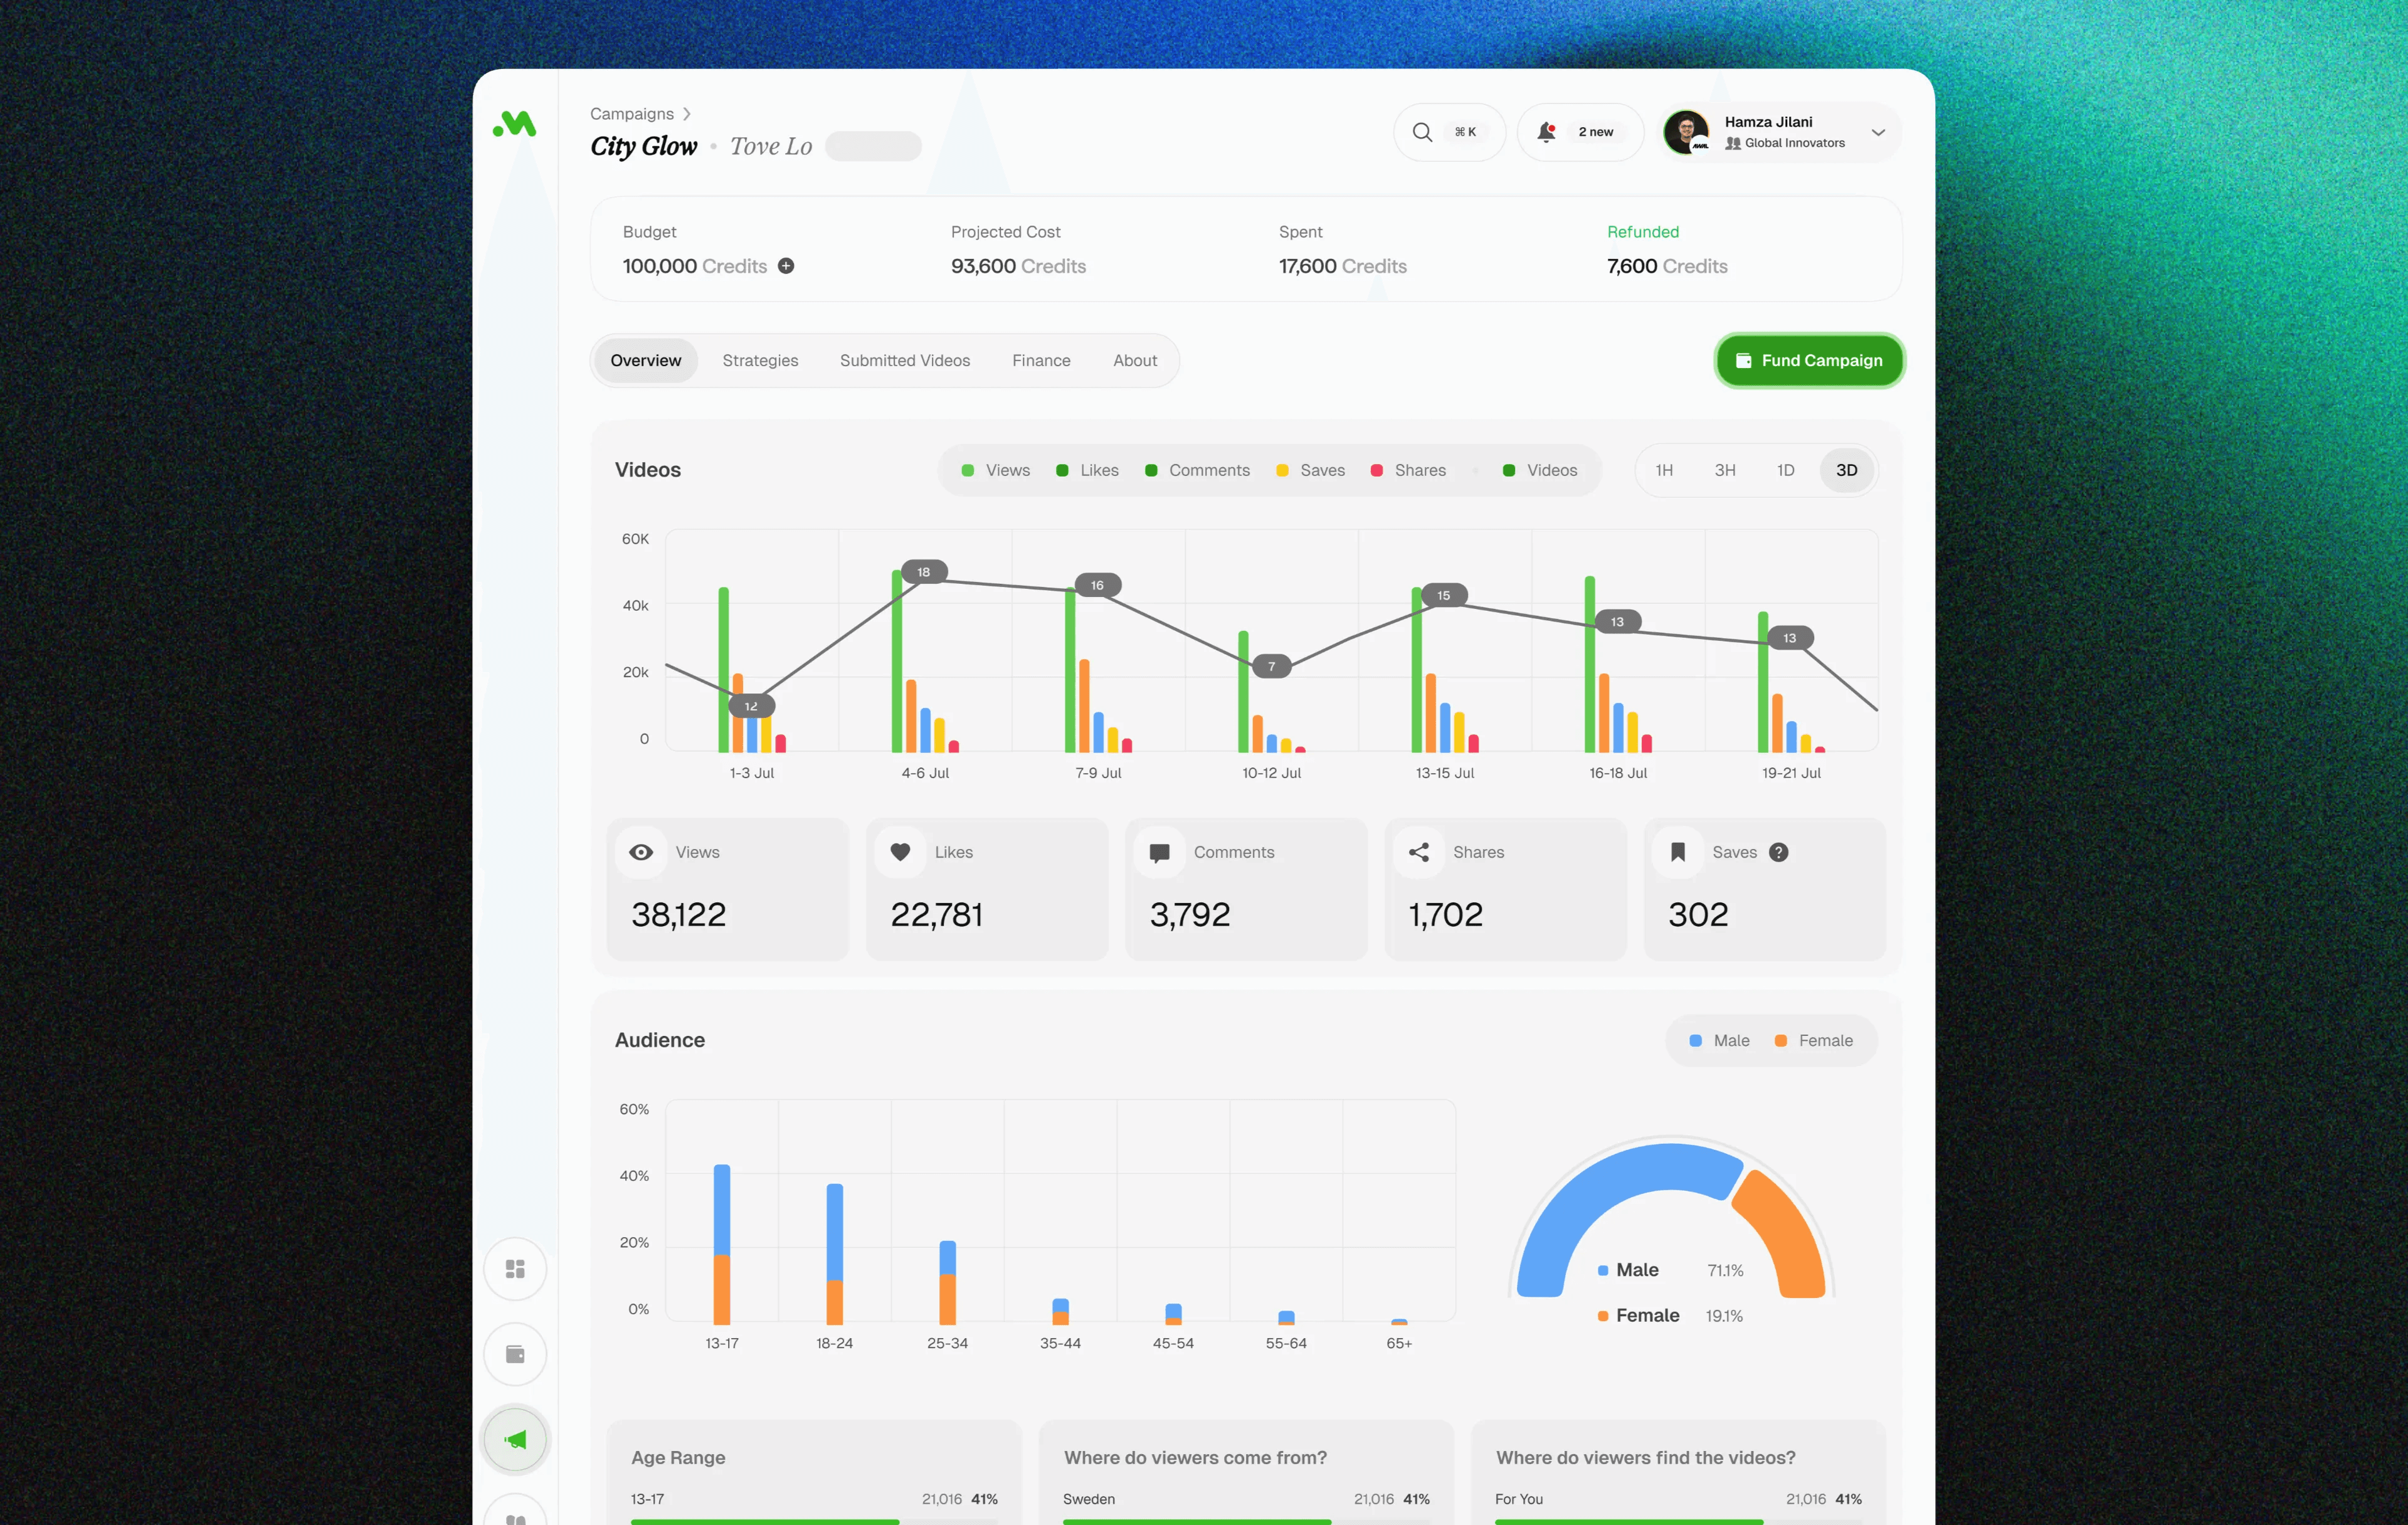
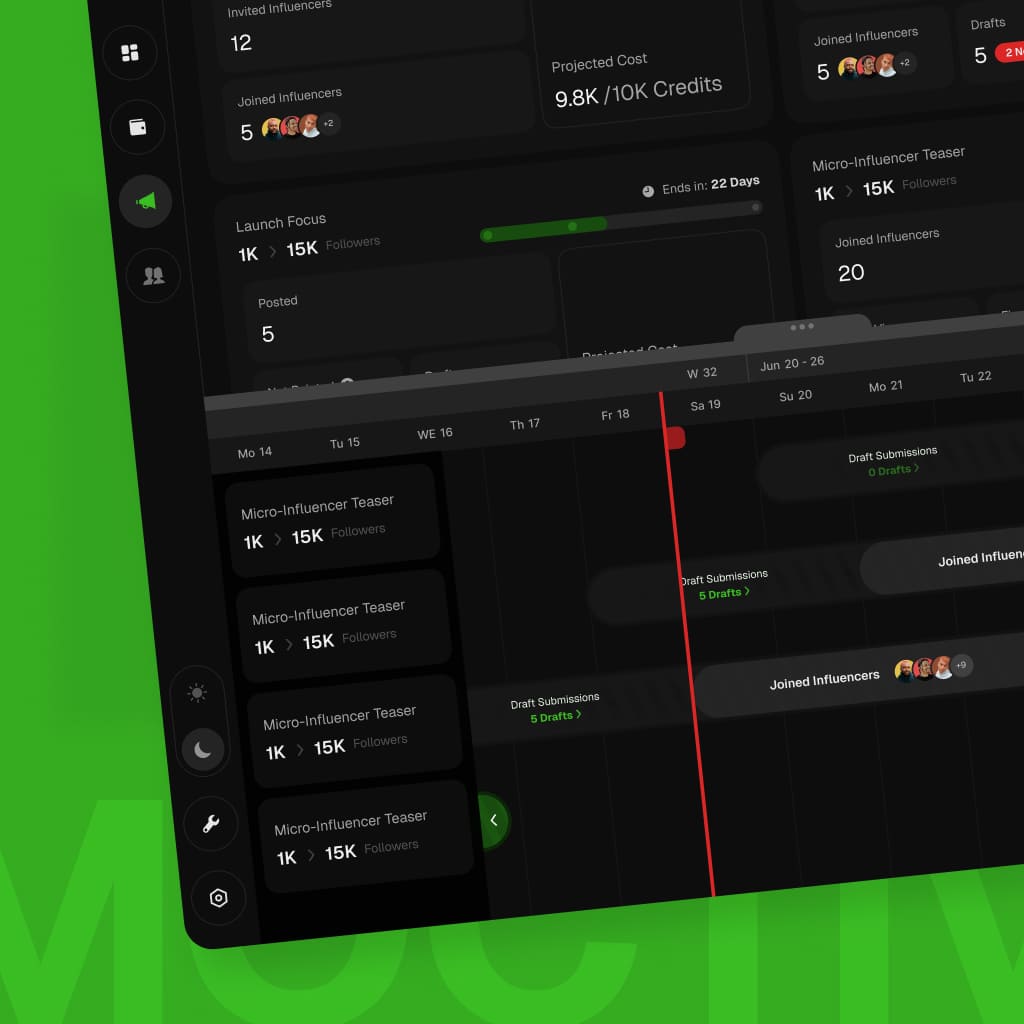
See how we designed Moktiv, an influencer marketing platform with campaign intelligence, performance signals and budget visibility.
Moktiv
Plexable’s published Moktiv case shows a high-density command-center interface that brings campaign intelligence, performance signals and budget context together. The experience uses KPI summaries, time-series views and audience breakdowns to support scanning and deeper investigation.

B2B SaaS
B2B SaaS
Product Type
Product Type
Stockholm, Sweden
Stockholm, Sweden
Location
Location
Campaign Analytics
Campaign Analytics
Core Experience
Core Experience
KPI + Trends
KPI + Trends
Visualization
Visualization
Budget Visibility
Budget Visibility
Decision Context
Decision Context
Audience Data
Audience Data
Supporting View
Supporting View
“
Stronger analytics UX gives your product
Clear
HierarchySeparate signals, context and actions
Give primary metrics a clear place, keep supporting context available and make the next analytical action visible.
Direct
ExplorationMove from overview to detail
Preserve the current comparison and filter context as people investigate the data behind a signal.
Consistent
PatternsKeep analytics behavior consistent
Use repeatable chart, filter, legend, tooltip and state patterns across product areas.
Responsive
Data ViewsPreserve meaning on smaller screens
Adapt dense views without hiding the comparisons, labels and actions users rely on.
Implementation
ConfidenceGive engineering clear rules
Handoff includes states, responsive behavior, interaction notes and reusable visualization specifications.
“
Data visualization for every level of detail
Since 2008, trusted by brands that scale.

STC
,

Speedi
,

Motory
,

POSRocket
,
Telenav

Moktiv
,

Giant
,
VIBES
VIBES
Vibes
,
And many more growing teams.
“
Are they trustworthy?
“
“
 clearestproofiswhatclientssayaftertheworkships.
“
Plexable was a pleasure to work with!
We thoroughly enjoyed collaborating with Hamza, Abdul, and the team. They took ownership from day 1 and impressed us with their exceptional UX/UI expertise, and went above and beyond to help and support us.
Suruchi Gupta
Founder, Confidential
“
Working with Plexable
will accelerate your projectWorking with Plexable will accelerate your project. They provided me with extremely high-quality User Experience / Flow diagrams, and they provided it in a quick time frame and as promised. Unlike with other offshore providers that are reactive, Plexable drove the process and provided strong suggestions for improvement throughout. They took real ownership of the project as if it were their own.
Ahmad Wahidi
CEO, ELmeter

“
It was a genuinely smooth experience.
It was a genuinely smooth experience. They have a great eye for design, communicate clearly, and handle feedback with real professionalism. This was my second project with them, and once again, they delivered high-quality work ahead of schedule.
Omar Aref
Founder, DadCam
“
They delivered High Quality, Thoughtful Designs
We hired Hamza and his agency again for follow-up design work on our B2B SaaS platform, and as always, they did a fantastic job. had a pleasure to work with throughout. Reliable and flexible - we’ll definitely continue working with him.
Charles Pan
CPO, Revel Street

“
I have only good things
to say about the team at PlexableI have only good things to say about the team at Plexable. They bleed design and have a wealth of experience in UI/UX. The result for me was a very coherent design that is both beautiful and functional. I enjoyed every part of this project and can't wait for more projects with Plexable.
Mohammad Jawahri
CEO, Ursumli Game
“
It was a genuinely smooth experience
It was a genuinely smooth experience. They have a great eye for design, communicate clearly, and handle feedback with real professionalism. This was my second project with them, and once again, they delivered high-quality work ahead of schedule.
Truls Kasa
Co-Founder, Moktiv

“
Plexable helped us refine our core experience
By focusing on the logic, not just the visuals. They took our complex requirements and simplified them into a very clean, usable interface. It’s rare to find a design team that stays this focused on the actual end-user throughout the whole process.
Confidential
Co-Founder, Uxability
“
Plexable was a pleasure to work with!
We thoroughly enjoyed collaborating with Hamza, Abdul, and the team. They took ownership from day 1 and impressed us with their exceptional UX/UI expertise, and went above and beyond to help and support us.
Suruchi Gupta
Founder, Confidential
“
Working with Plexable
will accelerate your projectWorking with Plexable will accelerate your project. They provided me with extremely high-quality User Experience / Flow diagrams, and they provided it in a quick time frame and as promised. Unlike with other offshore providers that are reactive, Plexable drove the process and provided strong suggestions for improvement throughout. They took real ownership of the project as if it were their own.
Ahmad Wahidi
CEO, ELmeter
“
It was a genuinely smooth experience.
It was a genuinely smooth experience. They have a great eye for design, communicate clearly, and handle feedback with real professionalism. This was my second project with them, and once again, they delivered high-quality work ahead of schedule.
Omar Aref
Founder, DadCam
“
They delivered High Quality, Thoughtful Designs
We hired Hamza and his agency again for follow-up design work on our B2B SaaS platform, and as always, they did a fantastic job. had a pleasure to work with throughout. Reliable and flexible - we’ll definitely continue working with him.
Charles Pan
CPO, Revel Street
“
I have only good things
to say about the team at PlexableI have only good things to say about the team at Plexable. They bleed design and have a wealth of experience in UI/UX. The result for me was a very coherent design that is both beautiful and functional. I enjoyed every part of this project and can't wait for more projects with Plexable.
Mohammad Jawahri
CEO, Ursumli Game
“
It was a genuinely smooth experience
It was a genuinely smooth experience. They have a great eye for design, communicate clearly, and handle feedback with real professionalism. This was my second project with them, and once again, they delivered high-quality work ahead of schedule.
Truls Kasa
Co-Founder, Moktiv
“
Plexable helped us refine our core experience
By focusing on the logic, not just the visuals. They took our complex requirements and simplified them into a very clean, usable interface. It’s rare to find a design team that stays this focused on the actual end-user throughout the whole process.
Confidential
Co-Founder, Uxability
“
Plexable was a pleasure to work with!
We thoroughly enjoyed collaborating with Hamza, Abdul, and the team. They took ownership from day 1 and impressed us with their exceptional UX/UI expertise, and went above and beyond to help and support us.
Suruchi Gupta
Founder, Confidential
“
Working with Plexable
will accelerate your projectWorking with Plexable will accelerate your project. They provided me with extremely high-quality User Experience / Flow diagrams, and they provided it in a quick time frame and as promised. Unlike with other offshore providers that are reactive, Plexable drove the process and provided strong suggestions for improvement throughout. They took real ownership of the project as if it were their own.
Ahmad Wahidi
CEO, ELmeter
“
It was a genuinely smooth experience.
It was a genuinely smooth experience. They have a great eye for design, communicate clearly, and handle feedback with real professionalism. This was my second project with them, and once again, they delivered high-quality work ahead of schedule.
Omar Aref
Founder, DadCam
“
They delivered High Quality, Thoughtful Designs
We hired Hamza and his agency again for follow-up design work on our B2B SaaS platform, and as always, they did a fantastic job. had a pleasure to work with throughout. Reliable and flexible - we’ll definitely continue working with him.
Charles Pan
CPO, Revel Street
“
I have only good things
to say about the team at PlexableI have only good things to say about the team at Plexable. They bleed design and have a wealth of experience in UI/UX. The result for me was a very coherent design that is both beautiful and functional. I enjoyed every part of this project and can't wait for more projects with Plexable.
Mohammad Jawahri
CEO, Ursumli Game
“
It was a genuinely smooth experience
It was a genuinely smooth experience. They have a great eye for design, communicate clearly, and handle feedback with real professionalism. This was my second project with them, and once again, they delivered high-quality work ahead of schedule.
Truls Kasa
Co-Founder, Moktiv
“
Plexable helped us refine our core experience
By focusing on the logic, not just the visuals. They took our complex requirements and simplified them into a very clean, usable interface. It’s rare to find a design team that stays this focused on the actual end-user throughout the whole process.
Confidential
Co-Founder, Uxability
“
Plexable was a pleasure to work with!
We thoroughly enjoyed collaborating with Hamza, Abdul, and the team. They took ownership from day 1 and impressed us with their exceptional UX/UI expertise, and went above and beyond to help and support us.
Suruchi Gupta
Founder, Confidential
“
Working with Plexable
will accelerate your projectWorking with Plexable will accelerate your project. They provided me with extremely high-quality User Experience / Flow diagrams, and they provided it in a quick time frame and as promised. Unlike with other offshore providers that are reactive, Plexable drove the process and provided strong suggestions for improvement throughout. They took real ownership of the project as if it were their own.
Ahmad Wahidi
CEO, ELmeter
“
It was a genuinely smooth experience.
It was a genuinely smooth experience. They have a great eye for design, communicate clearly, and handle feedback with real professionalism. This was my second project with them, and once again, they delivered high-quality work ahead of schedule.
Omar Aref
Founder, DadCam
“
They delivered High Quality, Thoughtful Designs
We hired Hamza and his agency again for follow-up design work on our B2B SaaS platform, and as always, they did a fantastic job. had a pleasure to work with throughout. Reliable and flexible - we’ll definitely continue working with him.
Charles Pan
CPO, Revel Street
“
I have only good things
to say about the team at PlexableI have only good things to say about the team at Plexable. They bleed design and have a wealth of experience in UI/UX. The result for me was a very coherent design that is both beautiful and functional. I enjoyed every part of this project and can't wait for more projects with Plexable.
Mohammad Jawahri
CEO, Ursumli Game
“
It was a genuinely smooth experience
It was a genuinely smooth experience. They have a great eye for design, communicate clearly, and handle feedback with real professionalism. This was my second project with them, and once again, they delivered high-quality work ahead of schedule.
Truls Kasa
Co-Founder, Moktiv
“
Plexable helped us refine our core experience
By focusing on the logic, not just the visuals. They took our complex requirements and simplified them into a very clean, usable interface. It’s rare to find a design team that stays this focused on the actual end-user throughout the whole process.
Confidential
Co-Founder, Uxability
“
Plexable was a pleasure to work with!
We thoroughly enjoyed collaborating with Hamza, Abdul, and the team. They took ownership from day 1 and impressed us with their exceptional UX/UI expertise, and went above and beyond to help and support us.
Suruchi Gupta
Founder, Confidential
“
Working with Plexablewill accelerate your project
Working with Plexable will accelerate your project. They provided me with extremely high-quality User Experience / Flow diagrams, and they provided it in a quick time frame and as promised. Unlike with other offshore providers that are reactive, Plexable drove the process and provided strong suggestions for improvement throughout. They took real ownership of the project as if it were their own.
Ahmad Wahidi
CEO, ELmeter
“
It was a genuinely smooth experience.
It was a genuinely smooth experience. They have a great eye for design, communicate clearly, and handle feedback with real professionalism. This was my second project with them, and once again, they delivered high-quality work ahead of schedule.
Omar Aref
Founder, DadCam
“
They delivered High Quality, Thoughtful Designs
We hired Hamza and his agency again for follow-up design work on our B2B SaaS platform, and as always, they did a fantastic job. had a pleasure to work with throughout. Reliable and flexible - we’ll definitely continue working with him.
Charles Pan
CPO, Revel Street
“
I have only good thingsto say about the team at Plexable
I have only good things to say about the team at Plexable. They bleed design and have a wealth of experience in UI/UX. The result for me was a very coherent design that is both beautiful and functional. I enjoyed every part of this project and can't wait for more projects with Plexable.
Mohammad Jawahri
CEO, Ursumli Game
“
They delivered High Quality, Thoughtful Designs
We hired Hamza and his agency again for follow-up design work on our B2B SaaS platform, and as always, they did a fantastic job. had a pleasure to work with throughout. Reliable and flexible - we’ll definitely continue working with him.
Truls Kasa
Co-Founder, Moktiv
“
Plexable helped us refine our core experience
By focusing on the logic, not just the visuals. They took our complex requirements and simplified them into a very clean, usable interface. It’s rare to find a design team that stays this focused on the actual end-user throughout the whole process.
Confidential
Co-Founder, Uxability
“
Plexable was a pleasure to work with!
We thoroughly enjoyed collaborating with Hamza, Abdul, and the team. They took ownership from day 1 and impressed us with their exceptional UX/UI expertise, and went above and beyond to help and support us.
Suruchi Gupta
Founder, Confidential
“
Working with Plexablewill accelerate your project
Working with Plexable will accelerate your project. They provided me with extremely high-quality User Experience / Flow diagrams, and they provided it in a quick time frame and as promised. Unlike with other offshore providers that are reactive, Plexable drove the process and provided strong suggestions for improvement throughout. They took real ownership of the project as if it were their own.
Ahmad Wahidi
CEO, ELmeter
“
It was a genuinely smooth experience.
It was a genuinely smooth experience. They have a great eye for design, communicate clearly, and handle feedback with real professionalism. This was my second project with them, and once again, they delivered high-quality work ahead of schedule.
Omar Aref
Founder, DadCam
“
They delivered High Quality, Thoughtful Designs
We hired Hamza and his agency again for follow-up design work on our B2B SaaS platform, and as always, they did a fantastic job. had a pleasure to work with throughout. Reliable and flexible - we’ll definitely continue working with him.
Charles Pan
CPO, Revel Street
“
I have only good thingsto say about the team at Plexable
I have only good things to say about the team at Plexable. They bleed design and have a wealth of experience in UI/UX. The result for me was a very coherent design that is both beautiful and functional. I enjoyed every part of this project and can't wait for more projects with Plexable.
Mohammad Jawahri
CEO, Ursumli Game
“
They delivered High Quality, Thoughtful Designs
We hired Hamza and his agency again for follow-up design work on our B2B SaaS platform, and as always, they did a fantastic job. had a pleasure to work with throughout. Reliable and flexible - we’ll definitely continue working with him.
Truls Kasa
Co-Founder, Moktiv
“
Plexable helped us refine our core experience
By focusing on the logic, not just the visuals. They took our complex requirements and simplified them into a very clean, usable interface. It’s rare to find a design team that stays this focused on the actual end-user throughout the whole process.
Confidential
Co-Founder, Uxability
“
Plexable was a pleasure to work with!
We thoroughly enjoyed collaborating with Hamza, Abdul, and the team. They took ownership from day 1 and impressed us with their exceptional UX/UI expertise, and went above and beyond to help and support us.
Suruchi Gupta
Founder, Confidential
“
Working with Plexablewill accelerate your project
Working with Plexable will accelerate your project. They provided me with extremely high-quality User Experience / Flow diagrams, and they provided it in a quick time frame and as promised. Unlike with other offshore providers that are reactive, Plexable drove the process and provided strong suggestions for improvement throughout. They took real ownership of the project as if it were their own.
Ahmad Wahidi
CEO, ELmeter
“
It was a genuinely smooth experience.
It was a genuinely smooth experience. They have a great eye for design, communicate clearly, and handle feedback with real professionalism. This was my second project with them, and once again, they delivered high-quality work ahead of schedule.
Omar Aref
Founder, DadCam
“
They delivered High Quality, Thoughtful Designs
We hired Hamza and his agency again for follow-up design work on our B2B SaaS platform, and as always, they did a fantastic job. had a pleasure to work with throughout. Reliable and flexible - we’ll definitely continue working with him.
Charles Pan
CPO, Revel Street
“
I have only good thingsto say about the team at Plexable
I have only good things to say about the team at Plexable. They bleed design and have a wealth of experience in UI/UX. The result for me was a very coherent design that is both beautiful and functional. I enjoyed every part of this project and can't wait for more projects with Plexable.
Mohammad Jawahri
CEO, Ursumli Game
“
They delivered High Quality, Thoughtful Designs
We hired Hamza and his agency again for follow-up design work on our B2B SaaS platform, and as always, they did a fantastic job. had a pleasure to work with throughout. Reliable and flexible - we’ll definitely continue working with him.
Truls Kasa
Co-Founder, Moktiv
“
Plexable helped us refine our core experience
By focusing on the logic, not just the visuals. They took our complex requirements and simplified them into a very clean, usable interface. It’s rare to find a design team that stays this focused on the actual end-user throughout the whole process.
Confidential
Co-Founder, Uxability
“
Plexable was a pleasure to work with!
We thoroughly enjoyed collaborating with Hamza, Abdul, and the team. They took ownership from day 1 and impressed us with their exceptional UX/UI expertise, and went above and beyond to help and support us.
Suruchi Gupta
Founder, Confidential
“
Working with Plexablewill accelerate your project
Working with Plexable will accelerate your project. They provided me with extremely high-quality User Experience / Flow diagrams, and they provided it in a quick time frame and as promised. Unlike with other offshore providers that are reactive, Plexable drove the process and provided strong suggestions for improvement throughout. They took real ownership of the project as if it were their own.
Ahmad Wahidi
CEO, ELmeter
“
It was a genuinely smooth experience.
It was a genuinely smooth experience. They have a great eye for design, communicate clearly, and handle feedback with real professionalism. This was my second project with them, and once again, they delivered high-quality work ahead of schedule.
Omar Aref
Founder, DadCam
“
They delivered High Quality, Thoughtful Designs
We hired Hamza and his agency again for follow-up design work on our B2B SaaS platform, and as always, they did a fantastic job. had a pleasure to work with throughout. Reliable and flexible - we’ll definitely continue working with him.
Charles Pan
CPO, Revel Street
“
I have only good thingsto say about the team at Plexable
I have only good things to say about the team at Plexable. They bleed design and have a wealth of experience in UI/UX. The result for me was a very coherent design that is both beautiful and functional. I enjoyed every part of this project and can't wait for more projects with Plexable.
Mohammad Jawahri
CEO, Ursumli Game
“
They delivered High Quality, Thoughtful Designs
We hired Hamza and his agency again for follow-up design work on our B2B SaaS platform, and as always, they did a fantastic job. had a pleasure to work with throughout. Reliable and flexible - we’ll definitely continue working with him.
Truls Kasa
Co-Founder, Moktiv
“
Plexable helped us refine our core experience
By focusing on the logic, not just the visuals. They took our complex requirements and simplified them into a very clean, usable interface. It’s rare to find a design team that stays this focused on the actual end-user throughout the whole process.
Confidential
Co-Founder, Uxability
“
Plexable was a pleasure to work with!
We thoroughly enjoyed collaborating with Hamza, Abdul, and the team. They took ownership from day 1 and impressed us with their exceptional UX/UI expertise, and went above and beyond to help and support us.
Suruchi Gupta
Founder, Confidential
“
Plexable was a pleasure to work with!
We thoroughly enjoyed collaborating with Hamza, Abdul, and the team. They took ownership from day 1 and impressed us with their exceptional UX/UI expertise, and went above and beyond to help and support us.
Ahmad Wahidi
CEO, ELmeter
“
It was a genuinely smooth experience.
It was a genuinely smooth experience. They have a great eye for design, communicate clearly, and handle feedback with real professionalism. This was my second project with them, and once again, they delivered high-quality work ahead of schedule.
Omar Aref
Founder, DadCam
“
They delivered High Quality, Thoughtful Designs
We hired Hamza and his agency again for follow-up design work on our B2B SaaS platform, and as always, they did a fantastic job. had a pleasure to work with throughout. Reliable and flexible - we’ll definitely continue working with him.
Charles Pan
CPO, Revel Street
“
I have only good thingsto say about the team at Plexable
I have only good things to say about the team at Plexable. They bleed design and have a wealth of experience in UI/UX. The result for me was a very coherent design that is both beautiful and functional. I enjoyed every part of this project and can't wait for more projects with Plexable.
Mohammad Jawahri
CEO, Ursumli Game
“
They delivered High Quality, Thoughtful Designs
We hired Hamza and his agency again for follow-up design work on our B2B SaaS platform, and as always, they did a fantastic job. had a pleasure to work with throughout. Reliable and flexible - we’ll definitely continue working with him.
Truls Kasa
Co-Founder, Moktiv
“
Plexable helped us refine our core experience
By focusing on the logic, not just the visuals. They took our complex requirements and simplified them into a very clean, usable interface. It’s rare to find a design team that stays this focused on the actual end-user throughout the whole process.
Confidential
Co-Founder, Uxability
“
Plexable was a pleasure to work with!
We thoroughly enjoyed collaborating with Hamza, Abdul, and the team. They took ownership from day 1 and impressed us with their exceptional UX/UI expertise, and went above and beyond to help and support us.
Suruchi Gupta
Founder, Confidential
“
Plexable was a pleasure to work with!
We thoroughly enjoyed collaborating with Hamza, Abdul, and the team. They took ownership from day 1 and impressed us with their exceptional UX/UI expertise, and went above and beyond to help and support us.
Ahmad Wahidi
CEO, ELmeter
“
It was a genuinely smooth experience.
It was a genuinely smooth experience. They have a great eye for design, communicate clearly, and handle feedback with real professionalism. This was my second project with them, and once again, they delivered high-quality work ahead of schedule.
Omar Aref
Founder, DadCam
“
They delivered High Quality, Thoughtful Designs
We hired Hamza and his agency again for follow-up design work on our B2B SaaS platform, and as always, they did a fantastic job. had a pleasure to work with throughout. Reliable and flexible - we’ll definitely continue working with him.
Charles Pan
CPO, Revel Street
“
I have only good thingsto say about the team at Plexable
I have only good things to say about the team at Plexable. They bleed design and have a wealth of experience in UI/UX. The result for me was a very coherent design that is both beautiful and functional. I enjoyed every part of this project and can't wait for more projects with Plexable.
Mohammad Jawahri
CEO, Ursumli Game
“
They delivered High Quality, Thoughtful Designs
We hired Hamza and his agency again for follow-up design work on our B2B SaaS platform, and as always, they did a fantastic job. had a pleasure to work with throughout. Reliable and flexible - we’ll definitely continue working with him.
Truls Kasa
Co-Founder, Moktiv
“
Plexable helped us refine our core experience
By focusing on the logic, not just the visuals. They took our complex requirements and simplified them into a very clean, usable interface. It’s rare to find a design team that stays this focused on the actual end-user throughout the whole process.
Confidential
Co-Founder, Uxability
“
Plexable was a pleasure to work with!
We thoroughly enjoyed collaborating with Hamza, Abdul, and the team. They took ownership from day 1 and impressed us with their exceptional UX/UI expertise, and went above and beyond to help and support us.
Suruchi Gupta
Founder, Confidential
“
Plexable was a pleasure to work with!
We thoroughly enjoyed collaborating with Hamza, Abdul, and the team. They took ownership from day 1 and impressed us with their exceptional UX/UI expertise, and went above and beyond to help and support us.
Ahmad Wahidi
CEO, ELmeter
“
It was a genuinely smooth experience.
It was a genuinely smooth experience. They have a great eye for design, communicate clearly, and handle feedback with real professionalism. This was my second project with them, and once again, they delivered high-quality work ahead of schedule.
Omar Aref
Founder, DadCam
“
They delivered High Quality, Thoughtful Designs
We hired Hamza and his agency again for follow-up design work on our B2B SaaS platform, and as always, they did a fantastic job. had a pleasure to work with throughout. Reliable and flexible - we’ll definitely continue working with him.
Charles Pan
CPO, Revel Street
“
I have only good thingsto say about the team at Plexable
I have only good things to say about the team at Plexable. They bleed design and have a wealth of experience in UI/UX. The result for me was a very coherent design that is both beautiful and functional. I enjoyed every part of this project and can't wait for more projects with Plexable.
Mohammad Jawahri
CEO, Ursumli Game
“
They delivered High Quality, Thoughtful Designs
We hired Hamza and his agency again for follow-up design work on our B2B SaaS platform, and as always, they did a fantastic job. had a pleasure to work with throughout. Reliable and flexible - we’ll definitely continue working with him.
Truls Kasa
Co-Founder, Moktiv
“
Plexable helped us refine our core experience
By focusing on the logic, not just the visuals. They took our complex requirements and simplified them into a very clean, usable interface. It’s rare to find a design team that stays this focused on the actual end-user throughout the whole process.
Confidential
Co-Founder, Uxability
“
Plexable was a pleasure to work with!
We thoroughly enjoyed collaborating with Hamza, Abdul, and the team. They took ownership from day 1 and impressed us with their exceptional UX/UI expertise, and went above and beyond to help and support us.
Suruchi Gupta
Founder, Confidential
“
Plexable was a pleasure to work with!
We thoroughly enjoyed collaborating with Hamza, Abdul, and the team. They took ownership from day 1 and impressed us with their exceptional UX/UI expertise, and went above and beyond to help and support us.
Ahmad Wahidi
CEO, ELmeter
“
It was a genuinely smooth experience.
It was a genuinely smooth experience. They have a great eye for design, communicate clearly, and handle feedback with real professionalism. This was my second project with them, and once again, they delivered high-quality work ahead of schedule.
Omar Aref
Founder, DadCam
“
They delivered High Quality, Thoughtful Designs
We hired Hamza and his agency again for follow-up design work on our B2B SaaS platform, and as always, they did a fantastic job. had a pleasure to work with throughout. Reliable and flexible - we’ll definitely continue working with him.
Charles Pan
CPO, Revel Street
“
I have only good thingsto say about the team at Plexable
I have only good things to say about the team at Plexable. They bleed design and have a wealth of experience in UI/UX. The result for me was a very coherent design that is both beautiful and functional. I enjoyed every part of this project and can't wait for more projects with Plexable.
Mohammad Jawahri
CEO, Ursumli Game
“
They delivered High Quality, Thoughtful Designs
We hired Hamza and his agency again for follow-up design work on our B2B SaaS platform, and as always, they did a fantastic job. had a pleasure to work with throughout. Reliable and flexible - we’ll definitely continue working with him.
Truls Kasa
Co-Founder, Moktiv
“
Plexable helped us refine our core experience
By focusing on the logic, not just the visuals. They took our complex requirements and simplified them into a very clean, usable interface. It’s rare to find a design team that stays this focused on the actual end-user throughout the whole process.
Confidential
Co-Founder, Uxability
Frequently Asked Questions
Yes. We can review the current experience, identify where hierarchy and interactions break down, and redesign the highest-impact views without forcing a complete product rebuild.
This service focuses on product strategy, UX, UI, prototyping, validation and handoff. BI-platform implementation or data engineering requires a separate, explicit scope.
Multi-Role Architecture defines roles, permissions, views and system structure. Data Visualization & Analytics UX defines how metrics, charts, comparisons, filters and analytical exploration work inside those views.
Yes. We can extend an existing system with visualization components and interaction rules, or define the analytics patterns that a broader design-system engagement should include.
Yes. We account for smaller screens, keyboard use, focus, contrast, clear labels, summaries and alternative ways to understand information where the product and data allow it.
The handoff can include validated flows, component states, interaction notes, responsive behavior, data-state coverage, chart rules and implementation-ready design specifications.
Yes. We can review the current experience, identify where hierarchy and interactions break down, and redesign the highest-impact views without forcing a complete product rebuild.
This service focuses on product strategy, UX, UI, prototyping, validation and handoff. BI-platform implementation or data engineering requires a separate, explicit scope.
Multi-Role Architecture defines roles, permissions, views and system structure. Data Visualization & Analytics UX defines how metrics, charts, comparisons, filters and analytical exploration work inside those views.
Yes. We can extend an existing system with visualization components and interaction rules, or define the analytics patterns that a broader design-system engagement should include.
Yes. We account for smaller screens, keyboard use, focus, contrast, clear labels, summaries and alternative ways to understand information where the product and data allow it.
The handoff can include validated flows, component states, interaction notes, responsive behavior, data-state coverage, chart rules and implementation-ready design specifications.
Yes. We can review the current experience, identify where hierarchy and interactions break down, and redesign the highest-impact views without forcing a complete product rebuild.
This service focuses on product strategy, UX, UI, prototyping, validation and handoff. BI-platform implementation or data engineering requires a separate, explicit scope.
Multi-Role Architecture defines roles, permissions, views and system structure. Data Visualization & Analytics UX defines how metrics, charts, comparisons, filters and analytical exploration work inside those views.
Yes. We can extend an existing system with visualization components and interaction rules, or define the analytics patterns that a broader design-system engagement should include.
Yes. We account for smaller screens, keyboard use, focus, contrast, clear labels, summaries and alternative ways to understand information where the product and data allow it.
The handoff can include validated flows, component states, interaction notes, responsive behavior, data-state coverage, chart rules and implementation-ready design specifications.
Still have a question?
Make your product data easier to understand and act on.
Say
Say

Hello
Hello
Interested in joining our team?

Jordan